Monday, November 15, 2010

The Midpoint Formula - How to Determine the Midpoint of a Line Segment


If you want to know how to find the midpoint, the midpoint formula is a simple formula that will help you to determine the midpoint between two points on a graph.  Alternately, another use of the midpoint formula is to tell you the center point of a line segment, the point where the distance to one end of the line segment equals the distance to the other end of the line segment.  (In the end, you can prove your answer using the distance formula.)

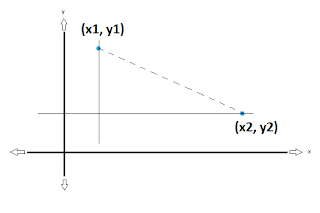
So, how to find the midpoint between two points?  To determine the midpoint, you first need to know the x and y coordinates of your two points.  Two x coordinates and two y coordinates.  When you have these 4 values, the process is easy.

Basically, you look at the x values, and then you look at the y values.  (Make sure you don't mix them up!)  Once you have identified these values, all you have to do is take the average of each set.  Here is the general formula you will need to know:

Average x = (x1 + x2) / 2
Average y = (y1 + y2) / 2

Simple, right?  "Determine the midpoint between two lines" may sound difficult, but right there is how simple it can be!  Of course, since the midpoint will be a coordinate pair (both an x and a y), you would likely be expected to present your midpoint as a coordinate pair.  So, a more general way of representing this formula is:

(x1 + x2)(y1 + y2) )
        2               2

We're basically saying "we want the x-value that is halfway between these 2 x-values, and the y-value that is halfway between these 2 y-values."  And that is your midpoint coordinate.  Let's try a couple of examples.

Easy one to start.


Find the midpoint between (1,1) and (3,3).  So, how to find the midpoint?  Graph this out, and you will immediately be able to tell that the midpoint is going to be (2,2) just by looking at it, but let's apply our formula from above.

Average x = (x1 + x2) / 2 = (1+3) / 2 = 2
Average y = (y1 + y2) / 2 = (1+3) / 2 = 2
Midpoint (2,2)

So, our formula gave us what we already knew.  That's great, but let's try one that is a bit harder to see automatically.

Find the midpoint between (3,1) and (8,7).  (Remember to keep the x's together and y's together!  Don't put an x with a y, or it will be wrong!)  How to find the midpoint?

Average x = (x1 + x2) / 2 = (3+8) / 2 = 11/2 = 5.5
Average y = (y1 + y2) / 2 = (1+7) / 2 = 8/2 = 4
Midpoint (5.5, 4)

So, that was a bit tougher, but still pretty simple and we got the answer easily.  Let's try one more, a bit more complicated.

Find the midpoint between (-5,-2) and (-3, 10).  Same formula to solve it, but using negatives this time.

Average x = (x1 + x2) / 2 = ((-5)+(-3)) / 2 = (-5 - 3) / 2 = -8/2 = -4
Average y = (y1 + y2) / 2 = ((-2)+10) / 2 = (-2 + 10) / 2 = 8/2 = 4
Midpoint (-4,4)

So, there you go.  Now you know how to find the midpoint!  Hopefully this will help you now to determine the location of the midpoint on your line segments!  For an extra challenge/proof, use the distance formula to find the distance between your midpoint and each end of the line segment.  If the distances are the same, then you are obviously correct!


Tuesday, October 19, 2010

Scalars and Vectors


For students just beginning to study physics, the concept of scalars and vectors is often confusing. We have always just added and subtracted things without problem, but putting fancy names to these concepts can be daunting and makes simple things seem a lot more difficult than they are. Here, I will try to explain what scalars and vectors are.

Of the two, scalars are the simpler quantity. A scalar is a measure of something that has only a magnitude to define it. A 10 meter length of cable is sufficient to define the length, whether we move it 2 meters to the left or 5 meters to the right. Also, 30 seconds is a scalar, and so is 25 degrees Celsius, and 30 liters. The magnitudes of these quantities are all that are needed to define them. Maybe to better understand that, we need to consider vectors as well...

Vectors are quantities that are defined by their magnitude AND their direction. This is the CRITICAL point to differentiate the two. Velocity is defined by the magnitude, but also requires the direction. If you are moving 10 m/s, you are moving 10 m/s IN SOME DIRECTION. This direction is required to fully define your velocity. The same is true when working with forces. You exert a magnitude of force in some direction, which fully defines the force. You can say that vectors are made up of a scalar component and a direction component.

When performing mathematical operations on scalars, you do so as you normally would. Run for 20 seconds, and then run for another 20 seconds, and you have run 40 seconds. Add 1 cup of water, and then add 2 cups, and you have added 3 cups. Since scalars are just composed of magnitude, you can simply operate on them as you always have. In fact, a lot of the math you have ever done, without problems, has been working with scalar quantities. As I said, just adding a fancy name doesn't make it any more difficult.

Working with vectors, however, is slightly more complex. You must always consider the direction component when doing the math. Many introductory physics courses will use examples of airplanes flying to demonstrate vectors. If the plane is flying 200 mph straight north (a vector), and the wind is blowing 50 mph straight east (another vector), you can imagine that the combined effect is that the plane is flying slightly at an angle rather than completely north. Actually, you can determine that the plane is actually travelling 206 mph in a direction of 14 degrees east of straight north, using simple trigonometry that you have already studied! (I will go over vector math in a future post.)


Hopefully, this post has more clearly explained the difference between scalar and vector quantities. Scalars are probably what you are most used to working with normally, whereas vectors require a little more thought, due to their direction component that always must be considered as well. Keep this key difference in mind as you work through your introductory physics homework problems.


Distance vs. Displacement


Continuing on in my posts in Introductory Physics, here I want to explain the difference between DISTANCE and DISPLACEMENT.

First of all, Distance is said to be a "scalar" property, which means that it is a quantity that has no direction associated with it, and is defined only by its magnitude. (Another scalar property is mass... all magnitude, no direction.) Conversely, Displacement is a "vector" property, which means that in addition to its magnitude, it also has a relative direction. (Another vector is velocity... it is defined by a magnitude AND a direction.)

With those definitions, we can differentiate distance and displacement even better. Imagine walking to school in the morning. The number of footsteps you have to take to arrive at school (the magnitude) describes the distance (maybe not the most convenient units, mind you!). If your school is straight up the street, or if you have to take a winding path through the park and over the tracks, the number of steps defines the distance... Direction is irrelevant in explaining the distance. You can walk 100 meters in a straight line, or 1000 meters turning left, right, left, and back again. The measured path you travel is the Distance.

On the other hand, Displacement DOES have direction associated with it. If you are going to school one day, and you go straight there, 100 meters up the street, your displacement is 100 meters North (or whatever direction). Now, on the next day, you have a doctor's appointment first, you have to drive 2000 meters up the street (past your school), and then afterwards you drive back the 1900 meters to your school. The DISPLACEMENT is 100 meters, because you end up 100 meters North of where you started. It doesn't matter the path you take to get there. You could travel around the world and back again, and you would still be displaced 100 meters from where you started. The DISTANCE, however, which has no direction but is just the footsteps (or whatever) you traveled, is much larger. On the first day, the distance is 100 meters. On the second day, you travel 2000 meters plus 1900 meters back, which is 3900 meters.

In summary, think of distance as the path taken to get somewhere, and describe it as some quantity without direction (eg. 50 meters away). Displacement is simply the difference between where you start and where you end, no matter the path taken, but considering the overall direction moved (eg. 25 meters to the right).

Hopefully that helps to explain Distance and Displacement. Drop me a line if you would like any more discussion.


Sunday, September 12, 2010

How to do Math with Significant Figures


Following up my general discussion of significant figures, and then my discussion of the rules of counting significant figures, in this post I will outline a few more rules of actually doing math with significant figures. There are only a few rules here, but this always seems to be the part that people make mistakes on... students and professionals alike. In using significant figures, which usually happens in scientific applications, the purpose is to ensure that the same level of precision is applied across your calculations.

For addition and subtraction, you have to break one of the rules that you have undoubtedly always been taught: carry all of your decimal places, and only round in your final answer. When using significant figures in these calculations, your final answer can only be as precise as your 'least precise' value.

Here's an example:

1.23 + 4.567 + 89.1011 + 121.3

In this example, the value with the least precision is the final one: 121.3. It only has one decimal place. As a result, your final answer CANNOT have any more precision than one decimal place. You can't be sure if it is 121.300000, or what is beyond the 3, and so your degree of precision must be just the one decimal place. Therefore, you perform this calculation as it appears, but you must round your final answer to one decimal place. In this case:

1.23 + 4.567 + 89.1011 + 121.3 = 216.1981 = 216.2

Subtraction calculations would work the same way.

For these types of calculations (addition and subtraction), it must be pointed out that the number of significant figures in your final answer does NOT depend on the number of sig figs in the original values.

As I mentioned above, you don't always have to carry your decimal places to the end. If this were a 2 part problem, perhaps like this:

1.23 + 4.567 + 89.1011 + 121.3 = x
x + 3 = y,

you would solve the first line to be x = 216.2, and then substitute this value into the second line, and add 216.2 + 3, which would give you the final answer of 219 (applying the same rule as above). You wouldn't have to carry all your decimal places over to the second part.

Hopefully that is clear enough of an explanation for addition and subtration.

For multiplication and division, the rule is the opposite. That is, the number of significant figures in your final answer is equal to the smallest number of significant figures involved in the calculation.

Here is an example:

5.56 x 2.998 = ?

We can see, based on the rules of counting significant figures, that there are 3 and 4 sig figs, respectively, in these two values. Therefore, our final answer must have 3 sig figs. So, instead of 16.66888, we would report 16.7 (3 sig figs). Otherwise, we would imply a degree of precision that was nowhere near what we were working with in the beginning.

I hope these explanations and examples have been helpful to explain some basic math functions involving significant figures. As always, please comment with any questions you might have! :)


Monday, September 6, 2010

Introductory Physics - Changing Units and Dimensional Analysis


With the start of a new school year, I'm going to try to post more frequently and to also include Introductory Physics concepts as well.

Before getting into those concepts though, I want to provide a quick tutorial for new students (or a refresher for others) on unit conversions, and then briefly discuss Dimensional Analysis. Understanding how to convert units can often point you to the correct way of solving problems. I previously posted on strategies that can be used for solving word problems, and also how to deal with unit conversions. I'll link to it from here, rather than going through it again. But please post comments and questions if there is anything more about it that you would like clarified.

Similar to unit conversions is Dimensional Analysis. What this is, is exactly what it sounds like... analyzing the dimensions of the problem. You need to make sure that the dimensions (units) of one side of the equation is equal to the dimensions (units) on the other. If they are not, you know you have done something wrong. Using a common example and knowing that velocity is equal to distance per unit time:

distance = velocity * time....
distance = (distance/time) * time....
distance = distance

Therefore, the dimensions of this equation make sense. You can similarly approach this by looking at the units, as described above and on the previous link.

meters = meters/sec * sec
meters = meters

The units make sense.

As you can see, Dimensional Analysis isn't as tricky as it sounds. You basically just check to make sure that the dimensions, or units, are the same on either side of the equals sign.

In my next posts, I would like to discuss Scientific Notation and Significant Figures... concepts that are notorious for giving students problems. I will try my best to clear things up. :)


Wednesday, June 2, 2010

What are Significant Figures?


Significant Figures are a concept that is introduced to students usually in Introductory Science courses, right near the beginning. However, it is a concept that continually confuses people, even beyond their school years. This is because, at first glance, Significant Figures appears to be the same as rounding... but there are many rules to follow, and that is where most of the difficulty arises.

As I said, the concept of Significant Figures ("sig figs") is associated with rounding, but there is more to it. It also describes the amount of uncertainty there is in a value, and is tied to that value's accuracy and precision. They are the digits in a value that are considered to be important, as a result of the precision in their measurement.

Here are a few basic examples:
  • A thermometer reads 26.9 degrees Celsius. This is 3 sig figs.
  • A scale displays a weight of 31.22 g. This is 4 sig figs.
  • A stopwatch shows 58.778 seconds. This is 5 sig figs.
So far, so good, right? Now, let's throw in a wrinkle. Sometimes, you don't count a zero as a Significant Figure. You ignore them ONLY IF they are at the very start of a number, such as before a decimal place, or at the very end of a number, such as 10.

Here are some more examples:
  • The number 0.232 has 3 significant figures.
  • The number 0.0076 has 2 significant figures.
  • The number 0.000000000000003 has 1 significant figure.
  • The number 100 has 1 significant figure.
  • The number 82000 has 2 significant figures.
  • The number 3,758,200,000,000,000 has 5 significant figures.
So, with those examples, you can hopefully now see how many significant figures a number with just a quick look.

Read on, where I will outline the general rules for determining the number of sig fig's, and also rules on how to do math with them.


Wednesday, May 26, 2010

The Distance Formula


This post is going to explain the distance formula: what it is, and where it comes from. When you see how to derive it, you won't need to worry about memorizing the formula anymore. And it's much easier than you think, despite looking kind of scary.  Please click the +1 button if this post helps you!

The distance formula is used to find the exact distance between two points, and can be easily explained with a right angle triangle to demonstrate it.

Assume that you want to find the distance between two points.  If you extend a horizontal line across from one point, and a vertical line through the other, these two lines will intersect at a right angle. You can then imagine the hypotenuse of this right angle triangle to be the distance between the two points in question.

How to derive the distance formula

From this, you can see that the distance between the two points is simply the length of the hypotenuse.

We already know that to find the length of the hypotenuse, we apply the Theorem of Pythagoras, which says that c2 = a2 + b2. (The square of the hypotenuse is equal to the sum of the squares of the remaining two sides). So from this, then, we see that we need to determine the lengths of the two sides that we have created by extending lines through our points to join at a right angle. And to find these lengths, all we need to know are the coordinates of our two points!

For a general triangle, then, we have something like this:

How to derive the distance formula

To find the horizontal length, it is just the difference between the two x-coordinates (ie. x2-x1). Think of it as taking a stick that is x2 units long, and chopping off a length of that stick that is x1 units long. The stick that you are left with, x2-x1, is the length of our horizontal side.

The same reasoning applies to find the vertical length, which is the difference between the two y-coordinates (ie. y2-y1). One comment I will make here, is that since we are talking about a length of a side, the length has to be the absolute difference between the two points (ie. you can't have a negative side length).

So then, for our general triangle, we have our two lengths, and let's call the hypotenuse "d" (as in, the distance between the two points).

How to derive the distance formula

So then, if we apply the Theorem of Pythagoras to this triangle we have created, we can come up with the distance formula very easily!

c2 = a2 + b2...... which we can change to read:
d2 = (x2-x1)2 + (y2-y1)2

And so we have:

d = sqrt [(x2-x1)2 + (y2-y1)2]

How to derive the distance formula

Let's quickly try with 2 points. You can draw the triangle out as I have above to follow along more closely. I will just do the quick calculation for you though.

Find the distance between the points (1,2) and (3,5).

d = sqrt [(3-1)2 + (5-2)2]
d = sqrt [(2)2 + (3)2]
d = sqrt [4 + 9]
d = sqrt [13]

And that's all there is to it. I hope that with this example calculation, I've been able to clearly explain how to derive the distance formula.  Once you know where a lot of these formulas come from, you'll never have to worry about memorizing them again!  If you learn how the derivation works first, then in time, you will automatically remember the formula.


Wednesday, March 3, 2010

Incredible Math Stories


There is a great section of Homeschool Hangout Zone dedicated to math that you should definitely check out. Its blog posts feature several links that talk about math and how it relates to the real world, rather than just how the numbers add up in your homework. Stories range from calculating the theoretical fastest sprint time of an athlete on a track, to describing how your brain changes when you do math problems, to using math to create incredible visual patterns. I highly recommend you visit the site to see the many interesting stories that it has to offer!


Tuesday, March 2, 2010

Great site for lessons and worksheets


I'd like to also direct some attention to Homeschool Math. It is a very informative site that has plenty of lessons and worksheets available for practice that cover several different math concepts. Maria also does something rather unique on her site, in that she presents many math concepts and lessons through the use of youtube videos embedded on her page (such as here). I highly recommend her site... the questions you have might have solutions there as well!


Math Puzzles and Fun


This is just a short little post. If you have an interest in math puzzles and things like this, it might be worth the trip for you to check out http://wildaboutmath.com/. I've been linking to their site for a long time now, and I just thought I would try to introduce some of my more recent followers to that site. There are math puzzles and all sorts of interesting bits of info over there. It's really well done. Check them out!


Friday, February 26, 2010

Which Measure of Central Tendency to Use? Mode, Mean, or Median?


A concept which may need a bit more explanation is: which average is appropriate for a given question? What is the best measure of central tendency? When would you use a median instead of a mean, or perhaps use a mode instead?

For any data set, you can perform the analysis to come up with a value for each average. However, here are a few basic guidelines to help you choose the most appropriate form of central tendency to describe your data.  If this is helpful, it would be great if you could please hit the +1 button to share it!

1. For a normal, random distribution of data (evenly distributed), the mean is preferred.
2. For a skewed data set, a median is more appropriate than a mean. The skewed data set (ie. extreme data points) will cause the mean value to be much more extreme than the median, and therefore less central.
3. The mode can be used for non-numerical data. Eg. hair colour in a classroom.

Here are a few examples of where each would be appropriate:

Mean:
1) students' heights in a classroom
2) temperature over a length of time

Median:
1) income of a group of people
2) test scores for a group of students

Mode:
1) finding the most common hair colour in a room
2) finding the most common car in a parking lot

Hopefully these guidelines will help you to determine which is the most appropriate measure of central tendency to report for your data set.

Again, if this was helpful, please share and hit the +1 for me! :)


Thursday, February 25, 2010

Perfect Squares


This post should have been put up when I posted about square roots (here, here, and here), because it is the exact opposite of a square root!

Where a square root of a number "x" is some number "y" that, when multiplied by itself, gives "x", a (perfect) square of a number is the result of multiplying a number by itself. That is to say, the square of "y", by multiplying "y" by "y", is "x". You can also talk about "squaring" a number, which is to find what the square is. (It can be both a noun and a verb.)

For example: the square of 4 is "4 x 4" = 16. Also, if you square 4, you get 16.

If you want to think of a visual representation of it, "what is the square of 5" is essentially the same as asking "what is the area of a square with a length of 5?" (Of course, all sides have equal lengths in a square.) As you can probably figure out already, to find the area of a square (or, in general, a rectangle) you multiply the length by the width. So here, it is obviously 5 x 5 and the area, or the square of 5, is 25.

This concept of perfect squares can also be extended to polynomials. For example, let's look at the following case:

(x+1)*(x+1) is the square of (x+1). It can also be written as (x+1)^2. You can do the visual trick i just described above if you want, using x+1 as the side length.

If you multiply (FOIL) these binomials, you get (x^2 + 2x + 1). As it is equal to our original expression, you can also say that this product is a perfect square, just as you can say that 16 or 25 is a perfect square. To find out what the square root of this is expression is, it is the same as asking what the square root of (x+1)*(x+1). Over time you will see patterns and be able to quickly notice that the square root of (x^2 + 2x + 1) is (x+1).

This shouldn't be too difficult of a concept to understand. I will do a few short examples, but post comments if you require clarification:

Find the square of 12:
12 x 12 = 144

Find the square of 25:
25 x 25 = 625

Find the square of (x-1):
(x-1)*(x-1) = (x-1)^2 = (x^2 - 2x + 1)

Find the square of (2x+3):
(2x+3)*(2x+3) = (2x+3)^2 = (4x^2 + 12x + 9)

It can also be noticed, and should be kept in mind, that squares will always be positive. Try it to see: plus x plus = plus... negative x negative = plus. A plus times a negative is NOT a square! Squares multiply the SAME number (sign and all!).

See my previous post about "completing the square" for some more stuff relevant to this post.


Friday, February 19, 2010

Completing the Square


"Completing the square" is a method of expressing a quadratic function, and it is an especially useful form for graphing the expression.

If we have a function:

f(x) = (x+1)^2 + 3,

from the rules of graphing (1, 2, 3) that I have posted already, we can tell that this is a second degree polynomial (upright parabola), shifted to the left 1 unit, and up 3 units. However, if I were to ask you to graph:

f(x) = x^2 + 2x + 4,

that appears to be much more complicated. However, it describes the exact same curve, it is just written differently. "Completing the square" is the process used to convert this complicated and nasty form into the simpler form above.

To do this, you basically have to ignore the constant number (4, in this case) at first. So, to start, we look at x^2 + 2x. Now, we essentially do FOIL backwards to get it in the form (x+y)(x+y), or (x + y)^2... a little tricky, but with practice, you will get better at it and recognize certain patterns.

I will write as step by step below, and hopefully that demo will explain what I mean with all of this:

f(x) = x^2 + 2x + 4... re-writing to focus what we're doing:

f(x) = [x^2 + 2x] + 4... now reverse FOIL, determine the constant required in the square brackets to make it a perfect square. To keep things balanced, whatever number you add, you have to also take away:

f(x) = [x^2 + 2x + 2] + 4 - 2... simplify:
f(x) = (x+1)^2 +2

To get an x^2 and a 2x, we can see that the First term has to be just x, and the Outside and Inside terms have to be the same (because it's a perfect square) and add to 2x, which is 1x plus 1x, and which means that the y term in the general statement has to be 1. So, to get the x^2 + 2x correct, we have determined that is corresponds to (x+1)^2. Then, as noted, whatever number we have added to the expression to make it a perfect square, we also have to subtract from the number that we started with.

Hopefully this makes some sense to you. Let's try another example:

f(x) = x^2 + 10x + 37
f(x) = [x^2 + 10x] + 37
f(x) = [x^2 + 10x + 25] + 37 - 25
f(x) = (x+5)^2 + 12

Much easier to graph this than when it started. :) Here's another:

f(x) = x^2 + 14x + 20
f(x) = [x^2 + 14x] + 20
f(x) = [x^2 + 14x + 49] + 20 - 49
f(x) = (x+7)^2 -29

Let's try one more, a bit harder this time. Same logic applies.

f(x) = 4x^2 + 4x + 19
f(x) = [4x^2 + 4x] + 19
f(x) = [4x^2 + 4x + 1] + 19 -1
f(x) = (2x + 1)^2 + 18


Related Posts